The Question Metrics Report, by default, will show the data for all learners that have been enrolled in the selected series. This view can provide valuable insights into how all learners have answered the questions and how many of them selected a particular answer.
✅To see metrics for a particular learner, use the Learner filter to search and apply a specific name
Left Hand Side Data Set
The best way to read the Insights Reports is to start with the left hand side data set.
✅The left hand side data set will show all attempts for each question in a vertical direction.
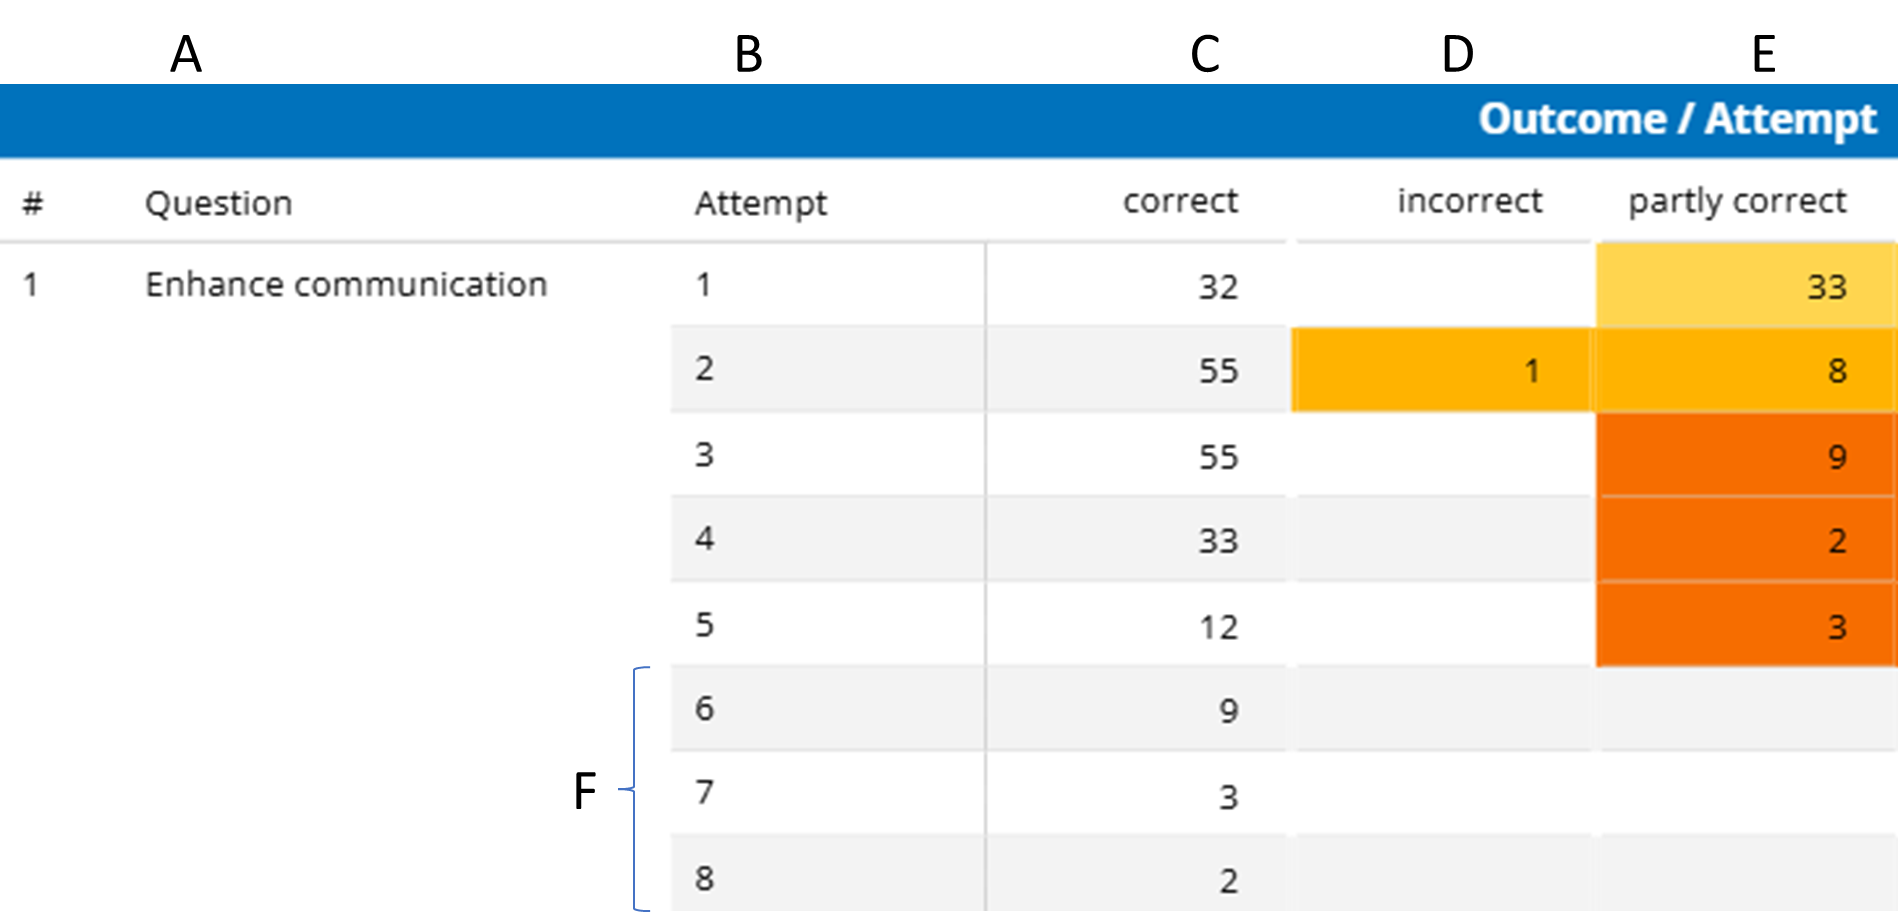
Information is represented in columns A - E which are described as follows:
- A. The ID number and title of the question
- B. The attempt number for the question
- C. The number of learners that answered the attempt correctly
(e.g. they chose all the correct answers) - D. The number of learners that answered the attempt incorrectly
(e.g. they chose all incorrect answers) - E. The number of learners that answered the attempt partly correct
(e.g. they chose some correct and some incorrect answers or they missed off selecting correct answers)
✅Once the last person that gets the question incorrect in attempt #5, they must then get it correct 3 times in a row to master it, this is what is show by F in attempts 6, 7 & 8.
Right Hand Side Data Set
Use the right hand side data set to explore deeper into the answer selections made for each question.
⚠️The right hand side of the report will only show the first 3 attempts for each question
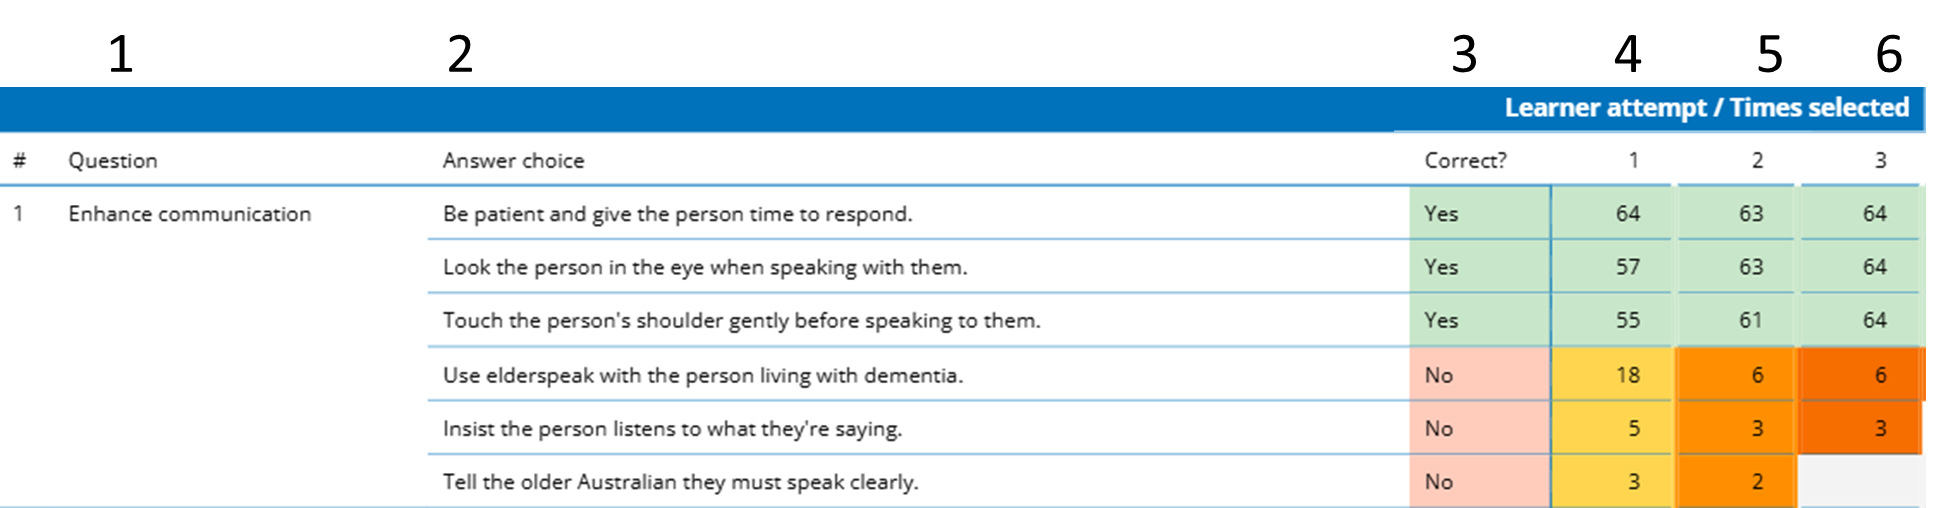
Information is represented in columns 1 - 6 which are described as follows:
- The number and title of the question
- The answer text that were chosen by learners (see note 1)
- Indicates if the answer is correct (yes) or incorrect (no)
- The number of learners that choose the answer on the 1st attempt
- The number of learners that choose the answer on the 2nd attempt
- The number of learners that choose the answer on the 3rd attempt
✅The colour indicators can help to easily show if correct or incorrect answers were chosen as follows:
- Green indicates a correctly chosen answer
- Yellow is incorrect on 1st attempt
- Light Orange is incorrect on 2nd attempt
- Dark Orange is incorrect on 3rd and greater attempts
- Grey is answer not selected
Note 1: If an answer was not selected by any learner it will not show in the list