▶️ Goto Insights then select Mastery using the View Selector on the Insights Reports.
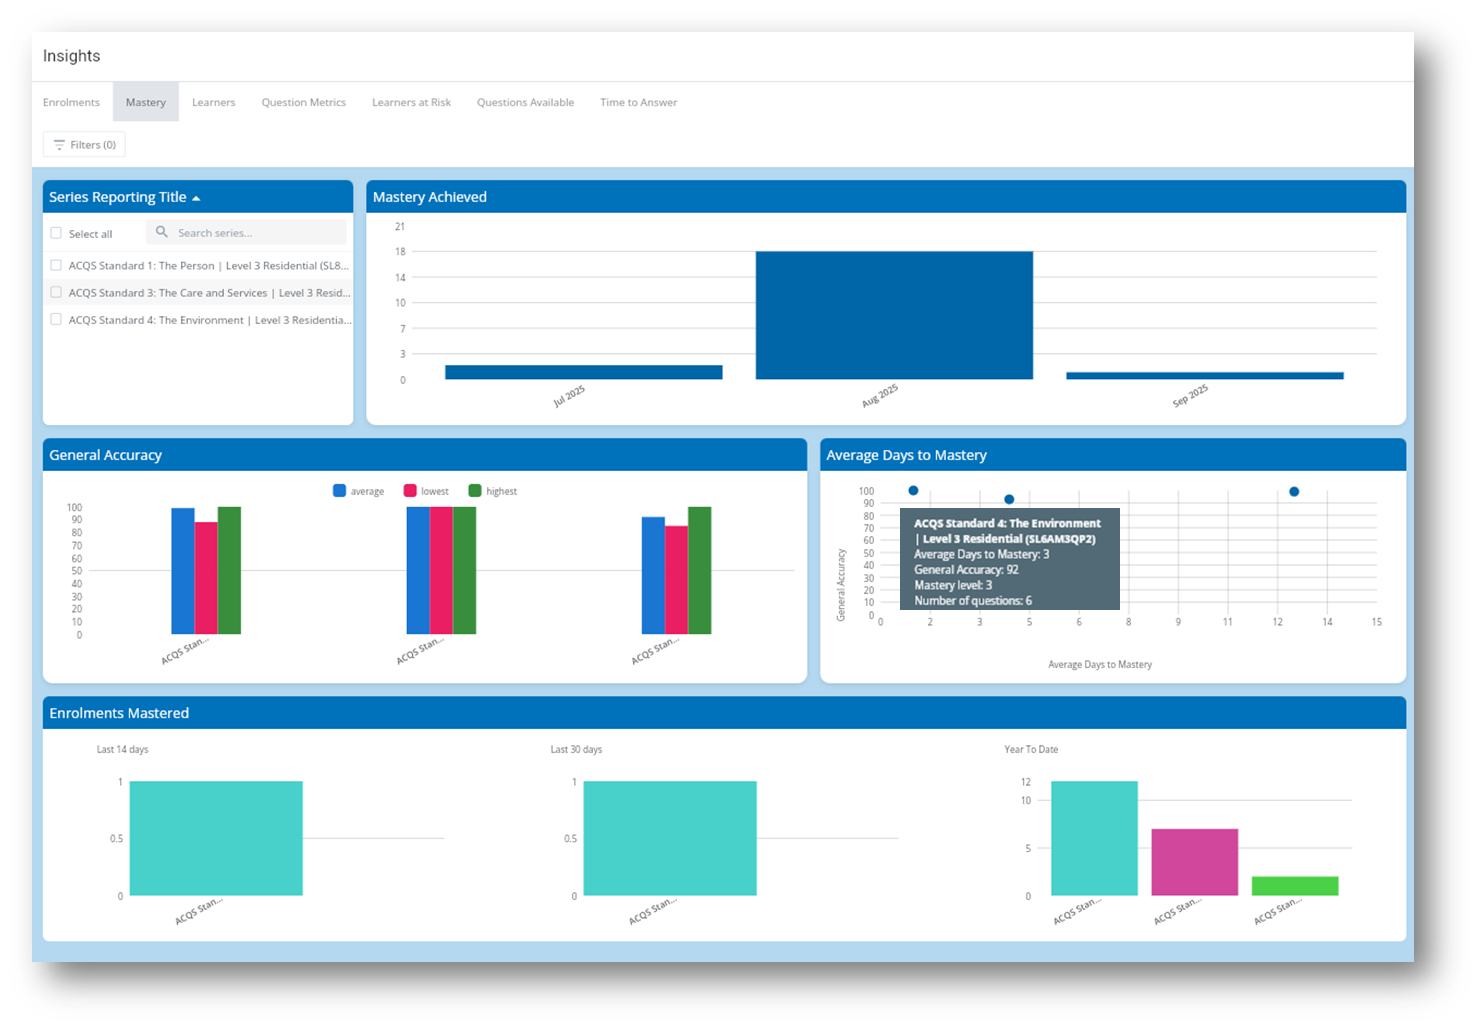
Enrolment Details
Series - shows the title of the series that learners have been enrolled in, selecting a series in the list will filter the results to that series only. Series can be selected individually (select per name to bold) or [multiple (using ctrl-select) and this will filter the enrolments to show only those that match. Select again to deselect (name not bold)].
Mastery Achieved Chart - shows the number of learners that have achieved mastery on a particular month. Hover-over each stack to see the exact number.
Average Days to Mastery Chart - shows the average number of days that it took learners to achieve mastery for each series. Hover-over a circle to see the Series and specific values for:
- Average Days to Mastery - calculated based on the average across all mastered enrolments and the days it took to master the series.
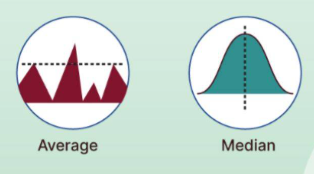
- General Accuracy - represents the median value which is the middle value in a list of numbers, when they are arranged in order from smallest to largest.
General Accuracy Chart - shows the average, lowest and highest values for accuracy for the selected series. [Hover-over each item to see the exact number]. The average value is calculated by summing of all values and dividing by the total number of values.
Enrolments Mastered Charts - shows the total number of enrolments for the selected series that were mastered in the last 14 days, 30 days and year-to-date.
Filters
Group Filter - Select one or more Groups to filter the enrolments to show only those enrolments that are members of the selected groups.
Tracking Code Filter - Select one or more tracking codes to filter the enrolments to show only those enrolments that match the selected tracking codes. Tracking codes can only be set at the time the enrolment is created
Mastered Date Filter - Select a from and to date range will filter the enrolments to show only those dates that match
Clear All - this will clear all filter selections
✅ Select a series to apply filtering and select the same series again to clear the series filter
✅ Use Insights Filters by select a Tracking Code to remove or add to the list or select Only to show stats for only this Tracking Code. Select the [-] Tracking Code Filter to reselect all Tracking Codes
⚠️ Preview enrolments cannot be mastered and will appear in Insights Reports
✅ For reference, the difference between the average value and the median value is shown in the diagram. Where the average is all values added together and divided by the number of values and median is the mid value in a set of values.