▶️ Select Question Metrics using the View Selector Tab on the Insights Reports. Wait for the Series List to be populated, Then select a specific Series from the list to show content, then content can be further refined by filter using Tracking Code, Group, Date Range or a specific Learner.
⚠️ The Question Metrics report can take a few minutes to load the Series list and also to load the main data set. If a Series is not selected, no data will be displayed.
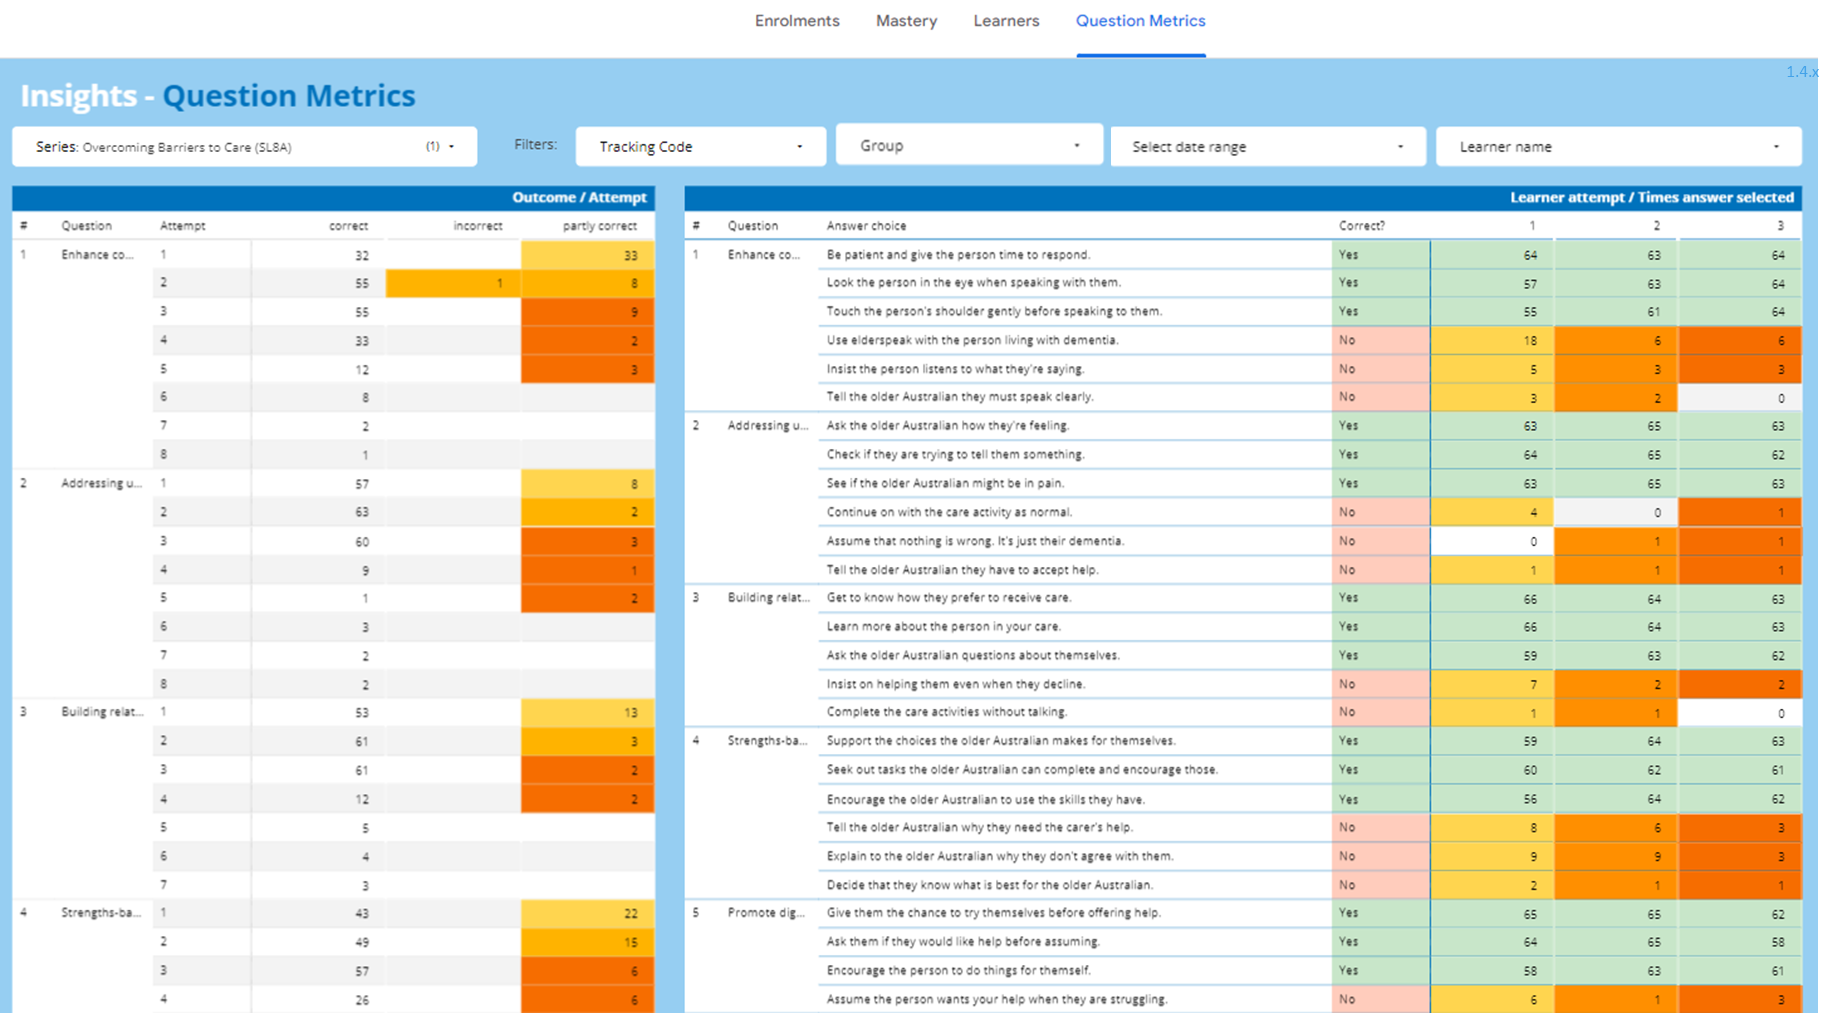
Outcome / Attempts
- This table shows the question number and title, the attempt number, how many learners were correct, incorrect or partly correct per attempt
Learner Attempt / Times answer selected
- This table shows the question title, the answer choice(s), if the answer is correct or not and then the number of learners who made that choice for each attempt count (attempt count my be limited to fit the width)
✅ Refer to How to read and interpret Question Metrics for tips
✅ A maximum of 3 attempts can be shown in the report due to space limitations. If the full data set is required you can export the data into csv format for further analysis
Colour Indicators
Attempt Counts change colour to show the following values:
🟢 Green = correct (all choices were correct)
🟡 Yellow = partially correct or incorrect on 1st attempt
🟠 Orange = partially correct or incorrect on 2nd attempt
🔴 Red = partially correct or incorrect on 3rd attempt
✅ Use the date selector to filter by; Start & End Dates, Last N Days, Today, Yesterday, This/Last week, This/Last Month, This/Last Quarter, This/Last Year or Year to Date
✅ Set the date to Auto Date Range, to restore any previously set date filter